
Most Overweight School Children Ranked by Hudson Valley District
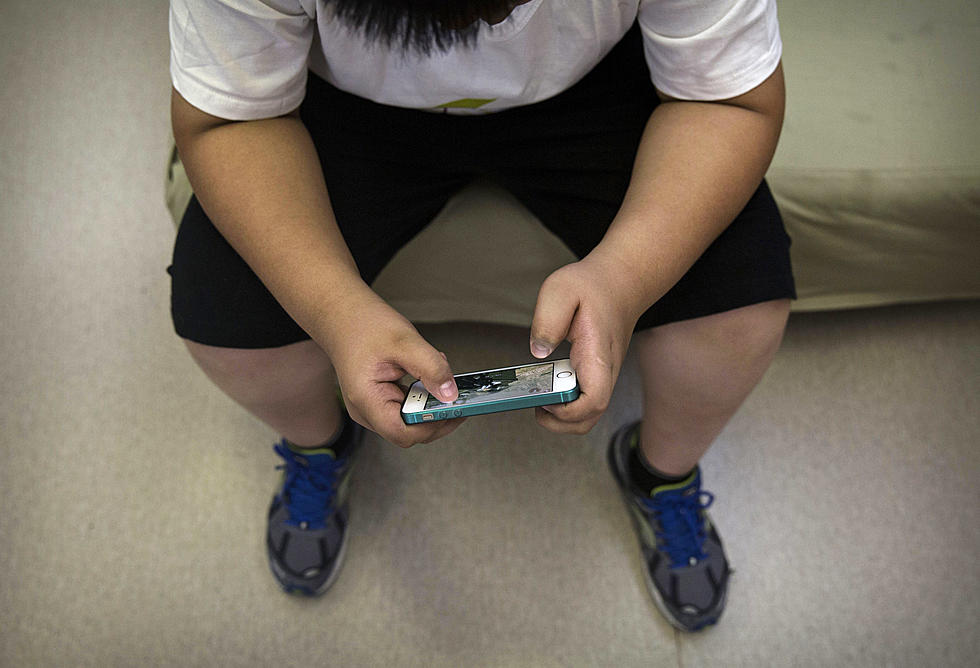
Just how unhealthy are the kids of the Hudson Valley? A look at the obesity rates in every school shows that some districts are raising dangerously overweight children.
The New York Department of Health keeps track of statistics taken each year at schools all over the state. As kids step on the scale at the nurse's office, the results are compiled and published to give New Yorkers an idea of which areas are dealing with serious health issues.
While some Hudson Valley school districts have an average percent of children who are overweight or obese, others appear to be in a serious health crisis.
We compiled a list of every school district in Dutchess, Orange and Ulster Counties and ranked the student bodies from the least to most overweight and obese. We know that parents in many of our poorer school districts are struggling to be able to provide healthy meals for their children, which has resulted in high percentages. But some of the more affluent school districts in the region are also showing many children who are either overweight or obese.
You can check the full list below to find your school district and the percentage of overweight or obese students that attend each. The list is ranked from lowest to highest.
Warwick Valley: 24.7%
Monroe-Woodbury: 27.8%
New Paltz: 28.6%
Greenwood Lake: 28.7%

Red Hook:27.2%
Rhinebeck: 27.7%
Goshen: 28.6%
Arlington 29.2%
Cornwall: 29.4%

Tuxedo: 29.5%
Ellenville: 30.4%
Spackenkill: 30.6%
Valley Central: 31.3%
Florida: 31.4%

Pine Bush: 31.5%
Wappingers: 31.5%
Washingtonville: 31.7%
Onteora: 32.0%
Pawling: 32.0%

Minisink Valley: 32.3
Beacon: 32.5%
Millbrook: 32.8%
Chester: 33.1%
Highland: 33.8%

Pine Plains: 34.2%
Hyde Park: 35.1%
Port Jervis: 36.5%
Highland Falls: 36.7%
Wallkill: 36.8%

Saugerties: 36.9%
Marlboro: 37.0%
Northeast: 37.4%
Middletown: 37.6%
Rondout Valley: 37.7%

Poughkeepsie: 40.0%
Kingston: 40.3%
Dover: 42.4%
Newburgh: 44.5%
The data reflects the latest information available from the 2019 school year. Unfortunately, due to the pandemic, many schools are reporting that things are actually getting worse than better. For more information on the data collected, you can visit the student weight data explorer at health.ny.gov.
LOOK: Things from the year you were born that don't exist anymore
READ ON: See the States Where People Live the Longest
More From WPDH-WPDA